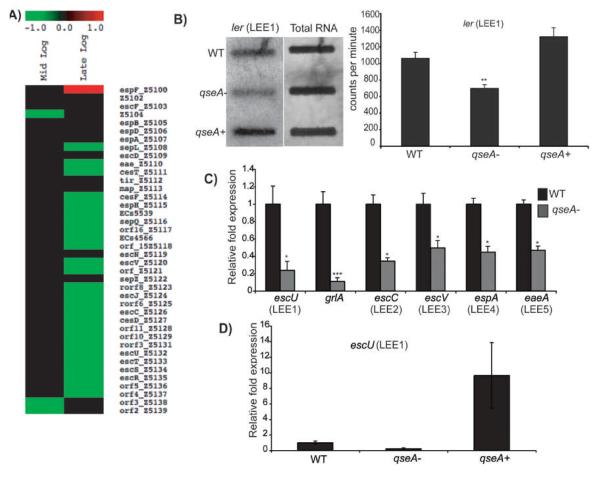
Figure 3.
A) Heat map from microarray analysis representing LEE genes with altered expression in the qseA mutant compared to WT at mid-exponential and late-exponential growth phases; B) RNA slot blot hybridized with the ler probe. RNA was purified from WT, the qseA mutant, and the qseA complemented strains grown in DMEM to late-exponential phase of growth. The graph corresponds to direct quantification of the concentration of target DNA from three slot blots. Error bars indicate standard deviations; C) Transcriptional profile of LEE gene expression for WT EHEC and the isogenic qseA mutant as measured by qPCR and expressed as fold differences normalized to WT strain 86-24. The error bars indicate the standard deviations of the ΔΔCT values (Anonymous, 1997); D) qRT-PCR measuring gene expression of escU (LEE1) of the WT, qseA mutant, and qseA complemented strains The error bars indicate the standard deviations of the ΔΔCT values (Anonymous, 1997). For the qRT-PCR analyses, the levels of rpoA transcript were used to normalize the CT values to account for variations in bacterial numbers. In all graphs, significance is indicated as follows: one asterisk, P ≤ 0.05; two asterisks, P ≤ 0.005; and three asterisks, P ≤ 0.0005.

