Figure 4.
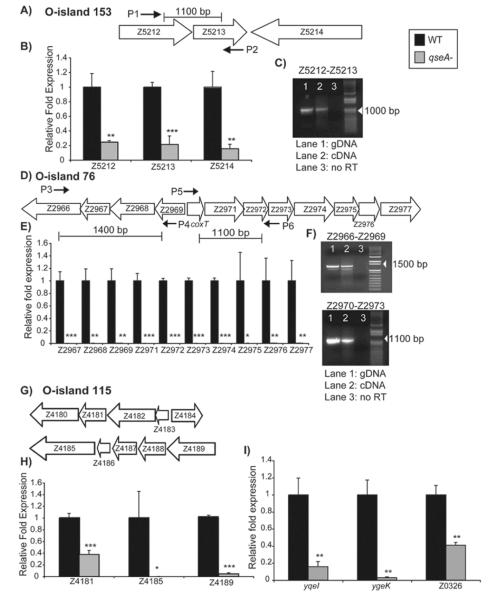
A) Schematic representation of O-island 153; B) Transcriptional profiles of Z5212, Z5213, and Z5214 gene expression for WT EHEC and the qseA mutant; C) RT-PCR analysis showing that Z5212 and Z5213 are co-transcribed. Primers flanking Z5212 and Z5213 show product when either the genomic DNA control (Lane 1) or cDNA is used (Lane 2), but show no product when no RT is added (Lane 3); D) Schematic representation showing the arrangement of O-island 76; E) Transcriptional profile of O-island 76 genes for WT EHEC and the qseA mutant; F) RT-PCR showing that Z2966 through Z2969 are co-transcribed and that Z2970 (coxT) through Z2973 are co-transcribed. Controls were set up as described in (C); G) Schematic representation showing the arrangement of O-island 115; H) Transcriptional profiles of Z4181, Z4185, and Z4189 for WT EHEC and the qseA mutant; I) Transcriptional profiles of yqeI, ygek, and Z0326 for WT EHEC and the qseA mutant. In figures B), E), H), and I), gene expression was measured by qPCR and expressed as fold differences normalized to WT strain 86-24. The error bars indicate the standard deviations of the ΔΔCT values (Anonymous, 1997). Significance is indicated as follows: one asterisk, P ≤ 0.05; two asterisks, P ≤ 0.005; and three asterisks, P ≤ 0.0005. The levels of rpoA transcript were used to normalize the CT values to account for variations in bacterial numbers.

