Figure 7.
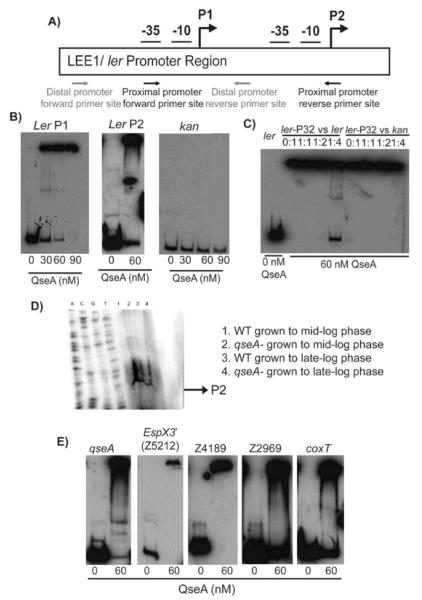
A) Schematic representation of the LEE1/ ler promoter region, indicating the P1 and P2 promoter regions; B) EMSA of the P1 promoter (−273 to −69 bp), the P2 promoter (−205 to −6), and the kan negative control promoter regions; C) Competition assays with QseA. The assay was performed using 60 nM of QseA in increasing amount of unlabeled ler promoter (−273 to −69 bp) probe. A competition assay was also performed using the kan promoter as a negative control; D) Primer extension of the ler P2 promoter. RNA was harvested from WT EHEC and the qseA mutant strains grown to mid- and late-exponential growth phases. The qseA-dependent promoter is indicated by the arrow; E) EMSAs of QseA with target promoters, including the −175 bp to +125 bp region of the qseA promoter, the −300 bp to +1 bp region (based on the translation start site) of the Z5212 promoter of O-153, the −300 bp to +1 bp region (based on the translation start site) of Z4189 of O-island 76, and the divergently transcribed Z2969 and coxT promoters from O-island 115 (−300 to +1 bp region based on the translation start site).

