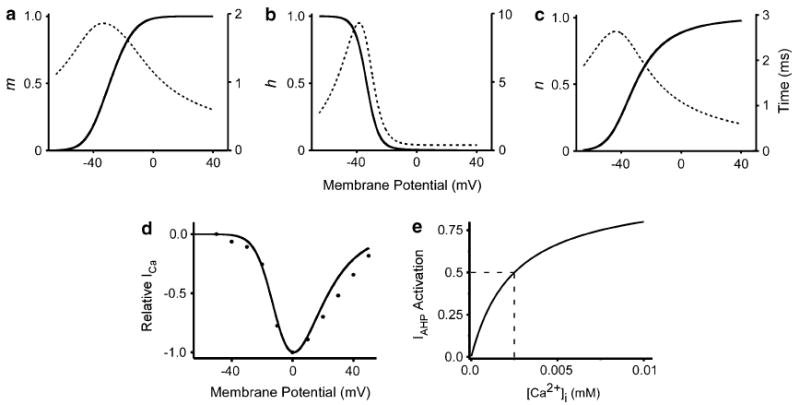
Fig. 1.

Activation, inactivation (solid lines) and time constants (dotted lines) for model conductances. a INa activation. b INa inactivation. c IK activation. Solid lines correspond to left axes, dotted lines correspond to right axes. d I/V relationship for ICa. Curve is the simulation. Points are data from cockroach (Wicher and Penzlin 1997) e Ca2+ sensitivity of Iahp; dashes note half activation point
