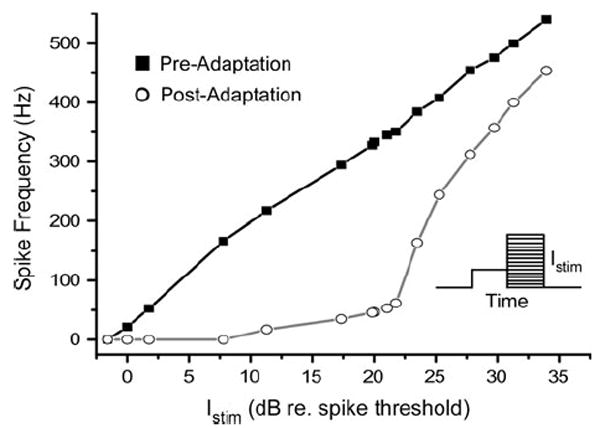
Fig. 3.

Adaptation of the model shifts the rate–intensity function to the right, but does not compress the curve by limiting maximum spike frequency. Squares are the instantaneous spike frequency (first two spikes) when stimulating at rest; circles are that following 1.5 s stimulation of Istim = 21 dB (relative to spike threshold). The linear-like response is similar to that found in vivo (Baden and Hedwig 2007). Inset shows schematic of stimulus for adapted I/O curve. A 1.5 s pulse at mean Istim is followed by a second 1.5 s pulse at variable amplitude
