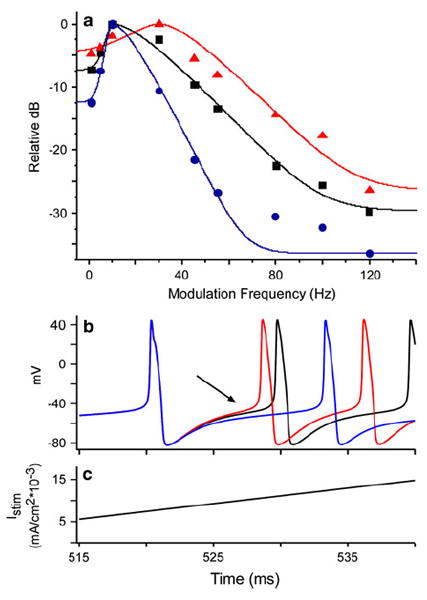
Fig. 8.

a Temporal modulation transfer functions (TMTF) for three values of ḡahp,1. Each point is the relative power in the spike frequency waveform at the stimulus modulation frequency. Curves are the roex model fit for each TMTF. Whereas the black data are for the mean parameter value (ḡahp,1 = 0.047 S/cm2), blue are for an increase (ḡahp,1 = 0.107 S/cm2) and red a decrease (ḡahp,1 = 0.022 S/cm2). These changes had the opposite effect on TMTF bandwidth (cutoff frequency: red 46.5 Hz; black 26.1 Hz; blue 18.7 Hz). The value for the parameter decrease (red curve) was chosen to match the calcium signal observed in ON1 dendrites in response to ultrasound relative to that for 5 kHz (47%; Baden and Hedwig 2007). b Membrane response to a ramped stimulus (c) is used to show difference in input resistance (Chen and Toney 2009). Colors represent the same ḡahp,1 values as in a. Arrow shows that after the depolarization of the first spike when Iahp is activated, the same Istim does not elicit the same depolarization. Higher values of ḡahp,1 require longer stimulation to elicit the next spike. Note that ramp stimulus starts at 500 ms
