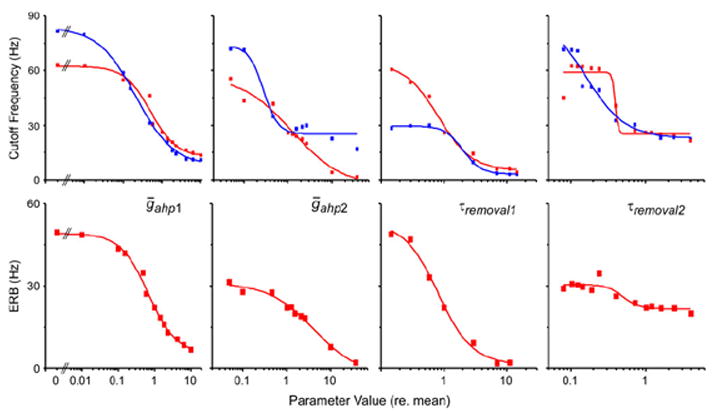
Fig. 9.

Change in temporal modulation transfer function associated with variance in the four adaptation parameters (noted in each column). The top row is the low-pass cutoff frequency as a function of parameter value (relative to mean parameter value from the simulation of nine G. rubens ON1s using response to a single pulse). Red symbols are for spectral analysis of the spike frequency waveform. Blue symbols are from analysis using spike frequency peaks/stimulus pulse, in which peak discrimination threshold is 200 Hz. The bottom row is the equivalent rectangular bandwidth of the spectral filter versus parameter value. Steepness of the ERB curves demonstrates the extent to which the change in cutoff frequency in the top row is due to a change in filter bandwidth as opposed to shifting center frequency. Only one parameter is varied at a time, with other parameter values equaling the mean. All curves are single Boltzman fits to the data (Table 2)
