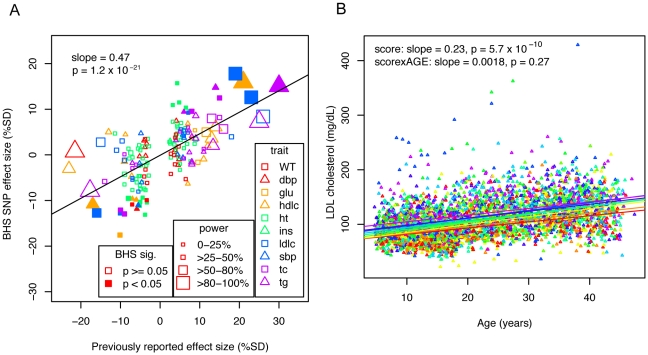
Figure 1. Effects of previously identified variants in the BHS.
A) Effect sizes of previously identified markers are plotted against observed effects in the BHS. SNP-trait associations are plotted by shape and color to indicate trait. The size of the point indicates the power to detect an association of the magnitude previously described, and whether a point is filled in or not indicates whether the association was significant at P<0.05 in the BHS. Linear regression lines are shown, with the slope and p-value of the association between previously reported effect sizes and the observed effect sizes. B) Individuals were scored based on the effect size of each previously identified marker and are grouped and color-coded based on the decile of their score. Linear lines are linear regression estimates of the average trajectory of each decile group.

