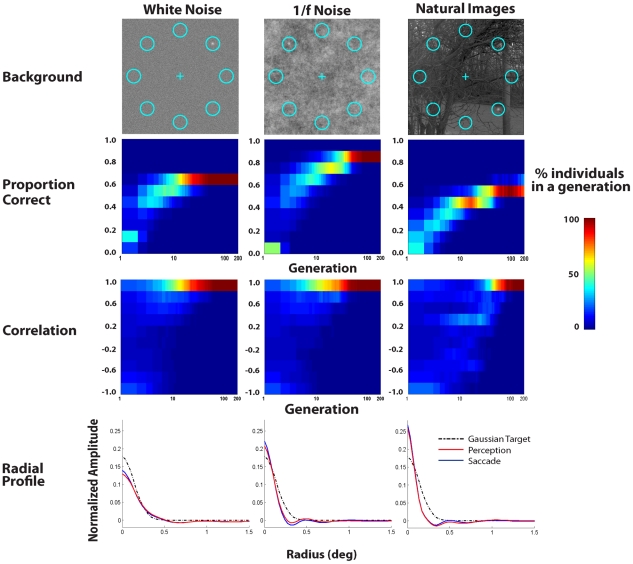
Figure 3. Evolution plots for detecting the isotropic Gaussian target embedded in three different backgrounds.
1st row: Sample images for the 8 alternative forced choice (AFC) search task for an isotropic Gaussian shaped luminance target with a steep visibility map (Figure 1c left) added to white noise, 1/f noise, and natural images. Center of circles indicate the possible target locations and the central cross is the initial fixation position for the models. 2nd row: Distribution of search accuracies for simulated individuals as a function of generation. 3rd row: Distribution of correlations between perception and saccade templates of individuals in each generation. Bottom row: Perception (red) and saccade (blue) templates radial profiles (averaged across all angles) of best performing simulated individual for each background type. Results are averages across ten different virtual evolution runs each with 500 generations. Plots only show data up to the 200th generation for which convergence has occurred. Radial profile of the Gaussian signal is shown in a dashed line for comparison.

