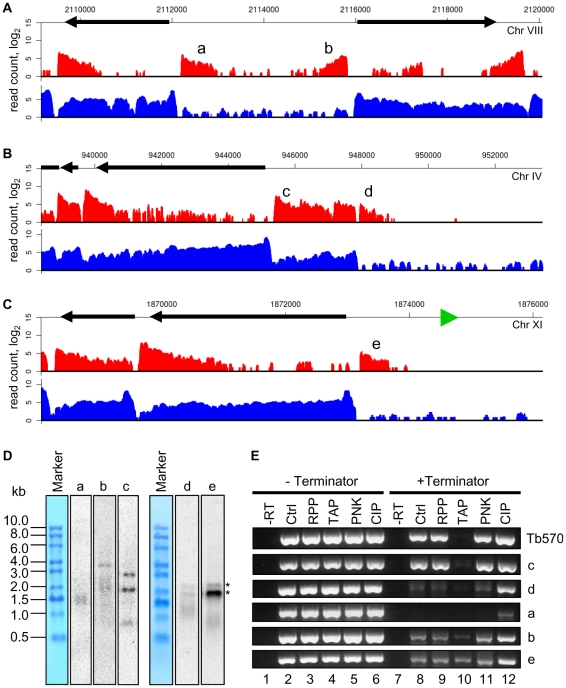
Figure 5. Polyadenylated transcripts without the SL sequence at suspected Pol II start sites.
(A) Plots of the number of reads (log2) from poly(A)-enriched (red) libraries and SL-enriched (blue) libraries aligning to a region of divergent transcription. a, b – transcripts underrepresented in the SL-enriched libraries. (B) Plots of the number of reads aligning to a region adjacent to a putative centromeric region on chromosome IV. c – a novel transcript, d – transcript underrepresented in the SL-enriched libraries. (C) Plots of the number of reads aligning to a region adjacent to a tRNA gene (green triangle). e – transcript underrepresented in the SL-enriched libraries. (D) Northern blots of RNA after one round of oligo(dT) selection with probes against the indicated transcripts. RNA size marker is visualized with methylene blue staining of the membrane. Multiple sizes transcripts are present for b and c, as suggested by the reads alignment plots in (A) and (B). Asterisks indicate bands cross-hybridizing to rRNA for the d and e blots. (E) RT-PCR assay to determine the nature of the 5′ ends of transcripts. After incubation of total RNA with the indicated enzymes, the samples were treated with or without Terminator exonuclease prior to reverse transcription and PCR. –RT – control sample without reverse transcriptase; Ctrl – control sample treated without any 5′-end-modifying enzyme; RPP – RNA 5′ polyphosphatase; TAP – tobacco acid pyrophosphatase; PNK – T4 polynucleotide kinase; CIP – calf intestinal alkaline phosphatase. Tb570 is a control detecting mRNA for Tb10.6k15.1610.

