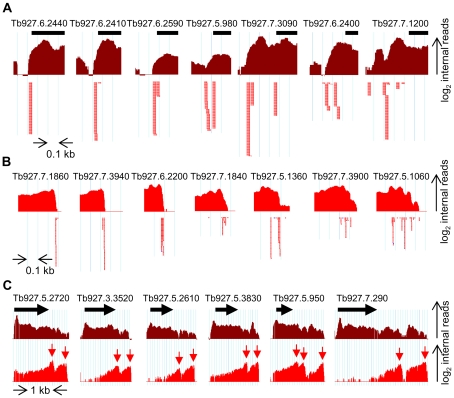
Figure 8. Complexity of pre-mRNA processing patterns in T. brucei.
(A) Examples of homogeneous (left) and heterogeneous (right) trans-splice sites. Shown is the pileup of number of internal reads (log2) from 5′-end-enriched libraries (dark red). Individual SL-containing reads are depicted by red arrows under the graph. The identity of each gene is indicated above the black bar representing the beginning of the ORF. The light blue vertical lines are 100 nt apart. (B) Examples of homogeneous (left) and heterogeneous (right) polyadenylation sites. The pileup of number of internal reads (log2) from 3′-end-enriched libraries (red) is depicted above the individual poly(A)-containing reads (red dots). Scale as in (A). (C) Examples of “truly” alternatively processed transcripts. The number of internal reads (log2) from 5′-end- (dark red) and 3′-end-enriched (red) libraries aligning to the genomic regions surrounding the indicated ORFs (black arrows) are depicted. Easily identifiable peaks in the 3′-end-enriched libraries pileup (red arrows) and end-reads (not shown) indicate the alternative 3′ ends of the transcripts containing the ORFs. Note the scale difference from (A) and (B).

