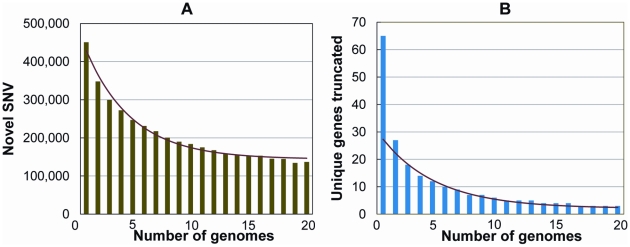
Figure 5. Number of novel SNVs and novel knocked-out genes as the number of genomes increases.
The total number of novel variants, and the total number of novel genes containing protein truncating or stop loss variants, continues to drop as additional genomes are added to the analysis. Shown are the number of unique SNVs (A) and unique genes carrying a homozygous protein-truncating or stop loss variant (B) per genome, as a function of the number of genomes already considered. The genomes were added in a random order to both analyses, and 1000 permutations were performed and averaged.

