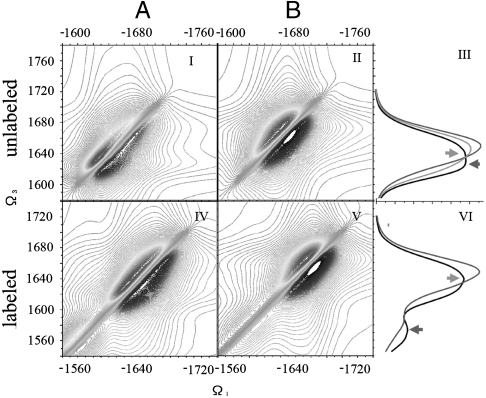
Fig. 2.
(Column A) 2D photon echo signal of conformer A (imaginary part) with XXXX polarizations configuration. The upper panel shows the signal for the unlabled samples, while the lower panel is for samples with residues 31–34 and 38–41 isotopically labeled by 13C18O. (Column B) Same signals for conformer B. (Right Column) The upper panel gives the absorption signal of the unlabeled samples. A (black), B (Red), and A + B (green). The signal of A is red-shifted compared with B. The lower panel gives the absorption signal of samples with both 31–34 and 38–41 labeled by 13C18O. There is a ∼20 cm-1 shift between the isotope peak of A and B.

