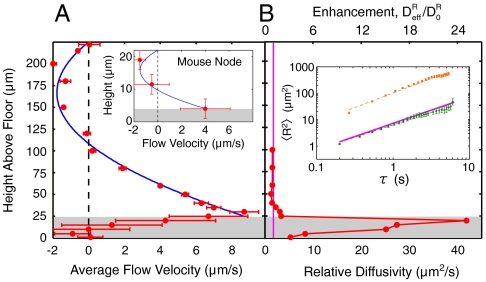
Fig. 4.
The velocity flow profile and effective relative diffusivity of biomimetic cilia-driven flow. The area below the cilia tips is denoted by the shaded regions. (A) Red points are the tracers’ average velocity, in the transport direction, at various heights above the floor. The solid blue curve is a least-squares fit to the Poiseuille–Couette flow profile of Eq. 2 with fit parameters u0 = 8.7 μm/s and ∇p = 1.05 Pa/m. The maximum average velocity occurs just above the cilia tips, demonstrating that the collectively driven transport at the tips acts analogously to the velocity u0 of the sliding plane in PC flow. Because the chamber is enclosed, there is a recirculation of fluid near the upper boundary. (Inset) We fit the PC flow profile to mouse nodal flow velocity data at three heights taken from Okada et al. (13), with parameters u0 = 4 μm/s and ∇p = 79 Pa/m. The discrepancy in ∇p between the node and our flow cell is likely due to the overall size differences of the two systems (see Appendix). (B) The biomimetic cilia motion induces mixing by producing a maximum relative diffusivity of 42 μm2/s, an enhancement of 25 in relation to the expected relative diffusivity of  (vertical magenta line) from the Stokes–Einstein relation. Above the cilia tips, the relative diffusivity rapidly decays back to the expected value. Horizontal error bars are on the order of the dot size. (Inset) Tracer MSDs and least-squares linear fits to the log of Eq. 5, from above (orange) and below (green) the cilia tips. The solid magenta line is the theoretical MSD with the expected relative diffusivity D0 and slope of 1.

