Fig. 4.
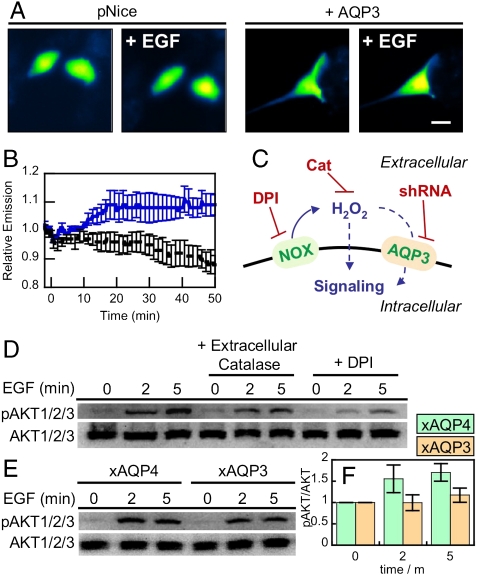
Natural levels of AQP3 can mediate uptake of Nox-generated H2O2 and effect intracellular signaling. (A) Live-cell imaging of changes in HyPer fluorescence upon treatment of HT29 cells with 100 ng/mL EGF. HT29 cells expressing HyPer and transfected with pNice as a control (“pNice” ) or AQP3 (“+AQP3”) before addition of EGF. Cells images at t = 0 and then again at t = 20 min (“+EGF”). 20 μm scale bar. (B) Time-course and quantification of A. HT29 cells expressing HyPer and transfected with pNice (black line) or AQP3 (blue line) stimulated with 100 ng/mL EGF at t = 0 and the changes in HyPer fluorescence monitored over time. Error bars are ± s.e.m. (n = 3). (C) Schematic illustrating where the H2O2 redox signal can by intercepted. EGF stimulation can activate a membrane-bound NADPH oxidase (Nox), which will then produce extracellular H2O2, which can then pass into the cell and modulate intracellular redox signaling. Diphenylene iodonium (DPI) will block the Nox production of H2O2 and extracellular catalase (Cat) will destroy any H2O2 produced outside of the cell. The genetic manipulation of AQP3 using shRNA will block any potential factilitated uptake of extracellular H2O2 by this protein. (D) Extracellular catalase and DPI abrogate EGF signaling in HT29 cells. Serum-starved HT29 cells were either preincubated with 5 μM DPI or DMSO as a carrier control for 30 min. 5 mg/mL catalase or water as a carrier control was then added while the cells were simulataneously stimulated with 100 ng/mL EGF. Phospho-AKT was measured by Western blot analysis of whole cell extracts, followed by stripping and reprobing for total AKT. (E) HT29 cells were transfected with either AQP3 shRNA or AQP4 shRNA as a control, serum starved, stimulated with 100 ng/mL EGF, and lysed at the various time points. Phospho-AKT was measured by Western blot analysis of whole cell extracts, followed by stripping and reprobing for total AKT. (F) Quantification of experiment as represented in (E) by analyzing 4 separate trials. pAKT normalized to total AKT and each experiment normalized to the t = 0 pAKT/AKT ratio. Error bars are ± s.e.m.

