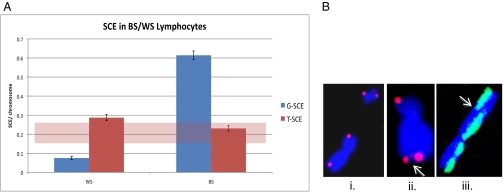
Fig. 1.
G- and T-SCE frequencies in immortalized human WS and BS lymphoblasts (telomerase-positive). (A) G-SCE frequencies were determined using fluorescence-plus-Giemsa staining, and T-SCE frequencies were determined using CO-FISH. The shaded region represents range of typical frequencies seen in other human cell lines. Error bars were calculated using SEM. (B) Illustrative examples of (i) telomere CO-FISH, characteristic strand-specific (single-sided) signals; (ii) T-SCE, CO-FISH telomere signal split between sister chromatids (arrow); and (iii) G-SCE, color switch between sister chromatids (arrow).

