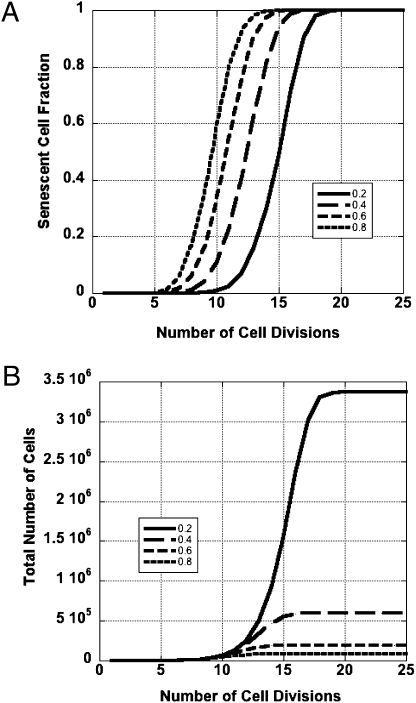
Fig. 4.
Senescence in silico. (A) T-SCE accelerate colony senescence. Computer simulations were performed in which colonies grew from single cells. The four curves correspond to T-SCE levels covering a range from 0.2 to 0.8 T-SCE per chromosome per cell division. As T-SCE rates rise, so does the fraction of the colony composed of senescent cells at any cell division. (B) T-SCE constrain colony growth. The four curves generated through computer simulation demonstrate that T-SCE can have a strong negative impact on colony size. With increasing T-SCE rates colonies increase in size more slowly, and the average colony size attained when all cells have senesced decreases almost exponentially.

