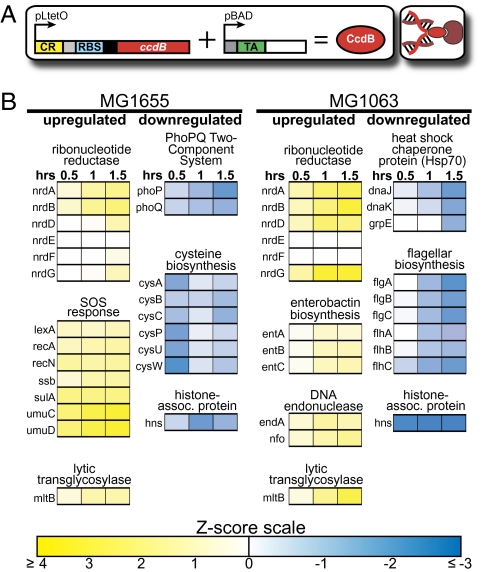
Fig. 3.
Transcriptome response to CcdB expression. (A) Riboregulator system. (B) Portion of the time-course gene expression response of CcdB-expressing MG1655 and MG1063 cells. Yellow and blue represent up-regulation and down-regulation, respectively. See SI Text for details concerning our analysis methods and Dataset S1 for the full microarray results.

