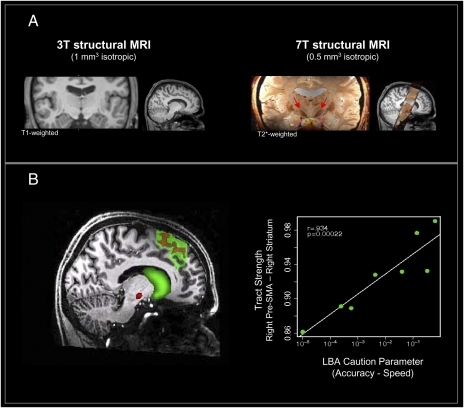
Fig. 4.
Structural differences in brain connectivity predict individual differences in decision making. (A) The STN (arrows) can be localized precisely with 7T scanning but not with 3T scanning. (B) Connectivity-based seed classification for the pre-SMA projecting into the striatum (green) and STN (red). Individual differences in tract strength between right pre-SMA and right striatum are associated with flexible adjustments of SAT.

