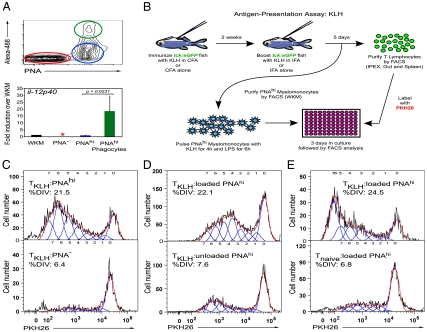
Fig. 5.
Functional characterization of Zebrafish DC-enriched populations. (A Upper) In vivo phagocytosis by PNAhi myelomonocytes. S. aureus Alexa 488 was injected i.p., and 16 h later cells were collected from IPEX, stained with PNA, and analyzed by FACS. Cells were gated on the myelomonocyte gate and divided into the following populations: PNA− (red gate and bar), PNAhi (blue gate and bar), and PNAhi phagocytes (green gate and bar). (Lower) qPCR analysis of il-12p40 transcript in these populations relative to that in WKM (black bar, arbitrary unit set at 1). Data are shown as average of fold change over WKM ± SD (n = 4). Asterisk indicates transcript not detected. (B) Illustration of the antigen-presentation assay using KLH to prime a polyclonal T-cell response, with the lck:eGFP zebrafish transgenic line as the source for naive (Tnaive) or KLH-primed (TKLH) T lymphocytes. (C) Proliferation responses as measured by dilution of PKH26 of lck+-TKLH cells stimulated with either PNAhi (Upper) or PNA− (Lower) myelomonocytes loaded with KLH protein. (D) lck+-TKLH cells stimulated with PNAhi myelomonocytes loaded (Upper) or not loaded (Lower) with KLH. (E) lck+-TKLH (Upper) or lck+-Tnaive (Lower) cells stimulated with PNAhi myelomonocytes loaded with KLH. T-cell proliferation results (C–E) are representative of three independent experiments. For all proliferation assays, the APC/T-cell ratio = 5:1. Histograms show T-cell proliferation as modeled by the FlowJo proliferation tool. %DIV = percent of T cells that divided.

