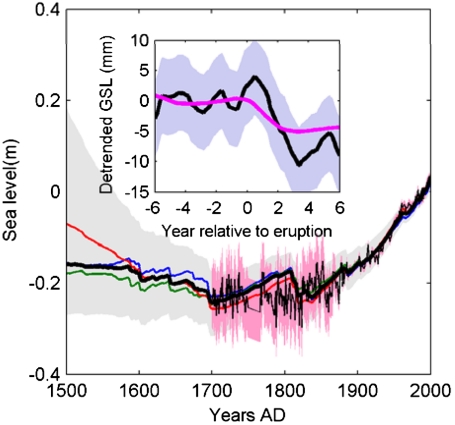
Fig. 1.
Sea-level reconstruction based on fitting past sea level to forcings from (20) blue; (21) red; and (22) green and their average (heavy black line and gray shadow showing 5–95% confidence interval). Tide gauge observations (thin black and their confidence interval (pink shading). The inset shows detrended observed (black) and modeled response (purple) to the five volcanic eruptions (Pinatubo, 1991; El Chichón 1982; Agung, 1963; Santa Maria, 1902; and Colima, 1890) with annual smoothing, shading shows 5–95% confidence interval.

