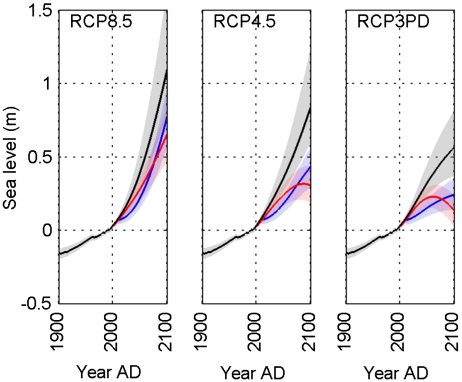
Fig. 3.
Sea-level simulations (relative to mean sea level 1980 to 2000) using mean forcings from before 2000 and RCP scenarios (18) since 2001. The past is constrained by observed global sea level, post 2010 simulation with the RCP scenarios labeling the figure with no geoengineering (black); with the scenario plus a constant -1.56 W m-2 (blue); the scenario plus space mirror (from 0–-4 W m-2) linear ramp (red). Shadows represent 5–95% confidence bands in each simulation.

