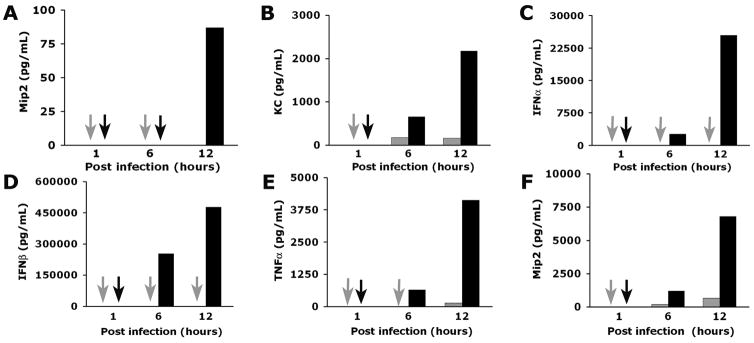
Figure 4. Production of cytokines and chemokines by mCL cholangiocytes and Raw 264.7 cells.
Concentrations of cytokines and chemokines in conditioned media of RRV-infected and naïve (controls) mCL cholangiocytes (panels A and B) and Raw 264.7 (panels C–F) cells at different times of culture as determined by ELISA. Arrows point to no detectable level; P<0.05 (between RRV-infected and naïve cells); grey bars=control (saline injected mice); black bars=RRV injected mice; N=3 for each time point and experimental group.

