
Figure 2. Target site conservation by location within the coding region or 3’ UTR.
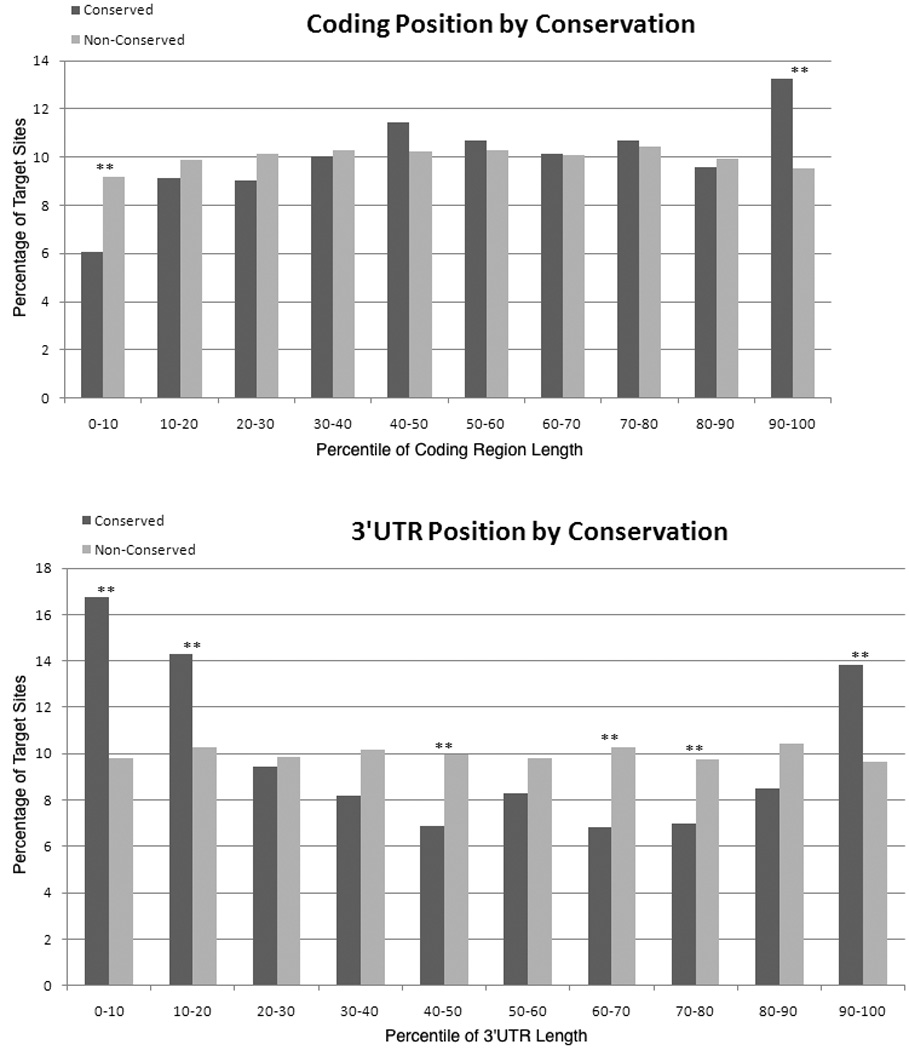
The location of microRNA binding sites was determined for all highly conserved microRNA families (as listed in TargetScan version 5.0) using a modified version of SiteSifter (www.sitesifter.org). Target sites were grouped based on their location within the coding region or 3’ UTR such that target sites within the first 10% of the coding region or 3’ UTR were considered together, target sites within the second 10% of the coding region or 3’ UTR were considered together, etc. For target sites within each group, the fraction that are well-conserved (black bars), defined as 14+ genomes for coding region target sites and 13+ for 3'UTR target sites, and the fraction that are poorly-conserved (empty bars), defined as the remainder of sites, are plotted. Conservation was determined based on a 17-genome alignment available from the University of California at Santa Cruz. A statistically significant enrichment for evolutionarily conserved sites is observed at the end of the coding region and at the beginning and end of the 3’ UTR. In the middle of the 3’ UTR, sites are more likely not to be evolutionarily conserved. Statistically significant differences are indicated with asterisks and reflect a p value less than 0.01 using a chi-squared test after correcting for multiple hypothesis testing.