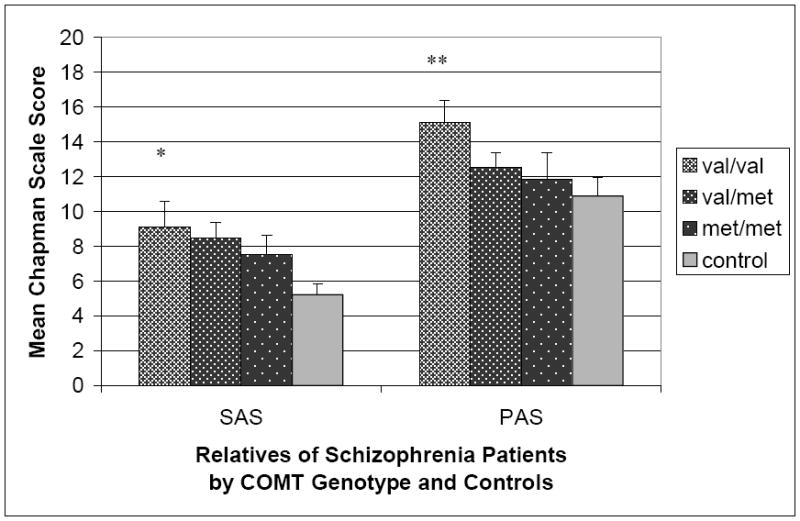
Figure 1.

Social Anhedonia Scale (SAS) and Physical Anhedonia Scale (PAS) scores in nonpsychiatric control participants and first-degree biological relatives of schizophrenia patients by COMT Val158Met genotype. Error bars represent standard errors of the mean.
** p < .005 for difference with control subjects.
* p ≤ .05 for difference with control subjects.
