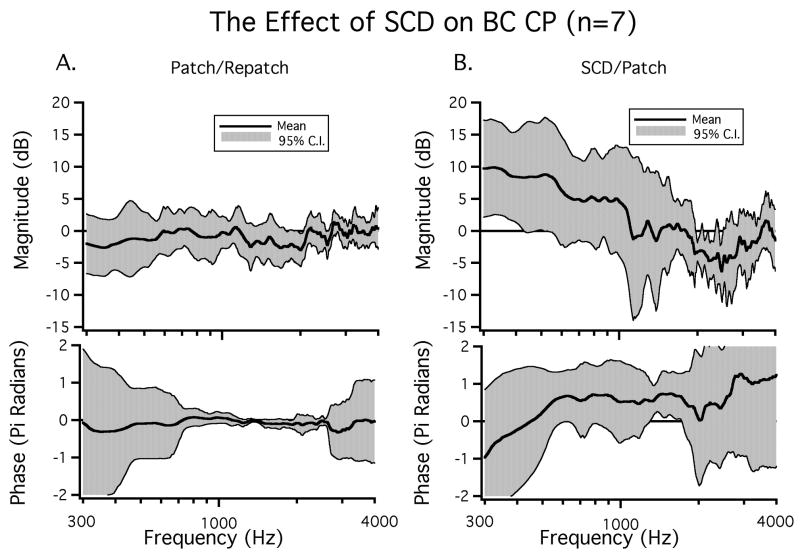
Figure 4.
The mean change in BC-CP between A) the patched and repatched conditions and B) the SCD open and patched conditions. The 95% confidence intervals as well as the means for both magnitude and phase are plotted (n=7). The large 95% confidence intervals around the phases in Figure 4A at low and high frequencies are, in part, due to uncertainties in phase unwrapping at the lowest and highest frequencies.

