
Figure 2.
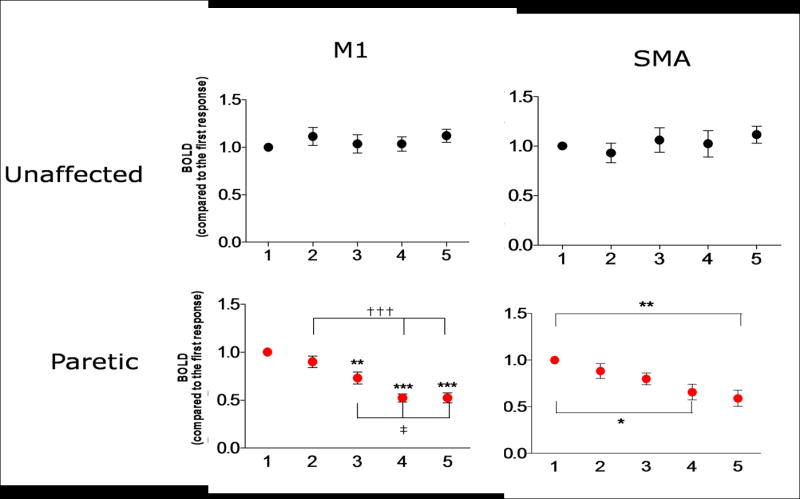
Amplitude and standard deviation of the mean BOLD signal amplitude in SMA (left) and M1 (right) throughout a single run of five epochs (x axis), normalized to the first epoch and averaged across patients, obtained in response to movement of the unaffected hand (A) and the paretic hand (B). *p<0.05, **p<0.01, ***p<0.0001 compared to the first response. †††p<0.001 compared to the second response. ‡p<0.05 compared to the third response.