
Figure 3.
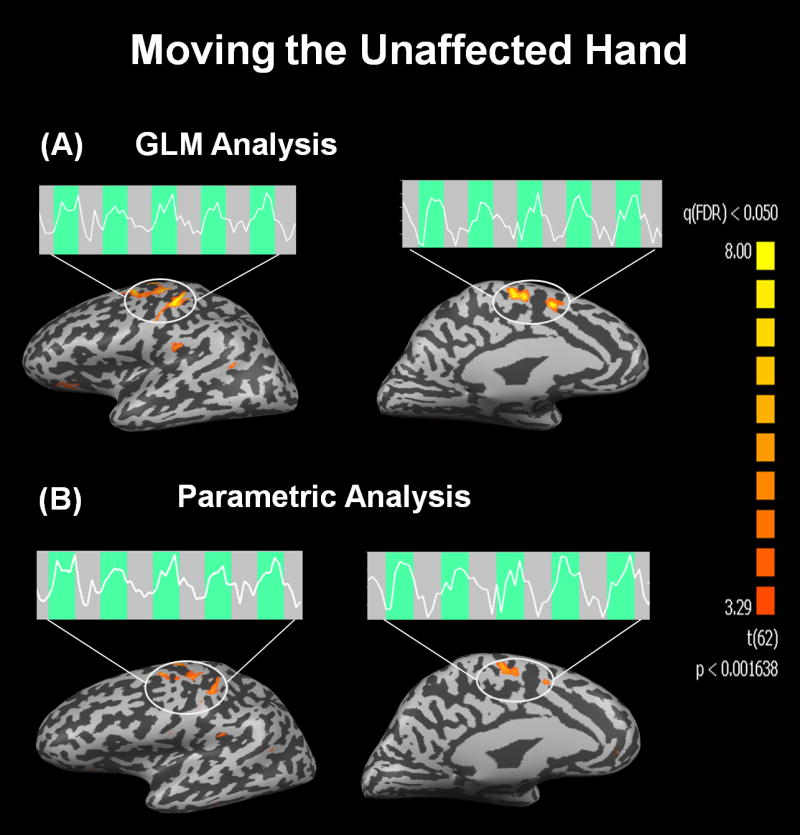
Functional activation maps obtained from a representative patient when moving the unaffected hand. Statistically significant results [q(FDR)<0.05] were found in M1 and SMA by both analysis methods: the conventional GLM (A) and the parametric modulated GLM (B). The BOLD signal time courses show a stable response throughout task execution both in M1 as well as in SMA.