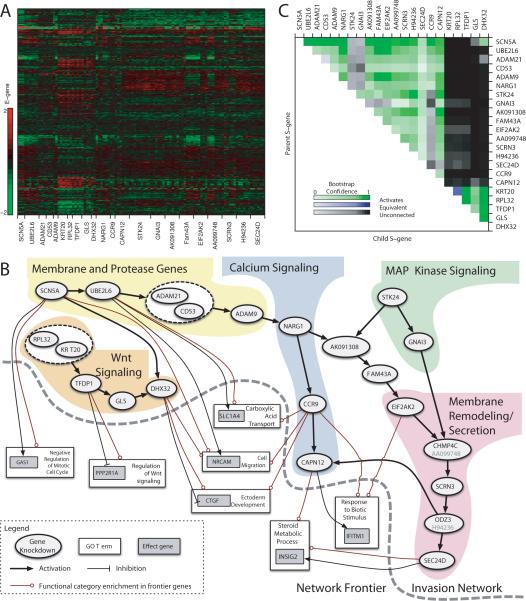
Figure 5.
Network interactions predicted from E-gene expression under S-gene knockdown. (A) Expression values of selected E-genes. Each row shows the log-ratio expression of a single E-gene under various targeted siRNA-mediated knockdowns relative to a nonsense siRNA control. (B) Inferred S-gene network and Frontier. Nodes represent S-genes (ovals), E-genes (gray boxes), and Gene Ontology categories (white boxes). Arrows indicate activation, and tees indicate repression. Mixed arrow/tee line endings indicate GO set enrichment among both activated and inhibited E-genes. For simplicity only direct interactions are shown. (C) S-gene interaction confidence. Each pixel in the heatmap corresponds to the proportion of times an S-gene interaction was recovered across bootstrap iterations. Upstream S-genes are labeled on the right; downstream on the top. Rows show upstream and columns show downstream bootstrap proportion.

