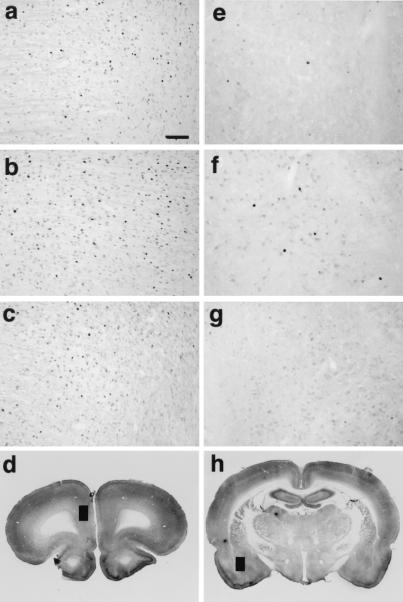
Figure 3.
Representative photomicrographs illustrating the quantitative data shown in Fig. 2. Panels show Fos-immunoreactive nuclei within the medial prefrontal cortex (a–c) and basolateral amygdala (e–g) determined after the delayed cue exposure test. Slices were obtained from rats tested under the S− (a and e), S+ (b and f), and S+SCH (c and g) conditions. (a–c and e–g, bar = 100 μm.) The locations of the fields represented in a–c (medial prefrontal cortex) and e–g (basolateral amygdala) are identified by black rectangles in d and h. The medial prefrontal cortical region sampled includes the prelimbic cortex (Cg3) and area I of the cingulate cortex (Cg1). The anteroposterior (AP) distance of the sections from bregma and approximate dorsal and ventral (DV) borders of the sampled fields are AP 3.2, DV −2.5 to −4.5 (medial prefrontal cortex) and AP −2.12, DV −7.6 to 8.8 (basolateral amygdala; ref. 19).

