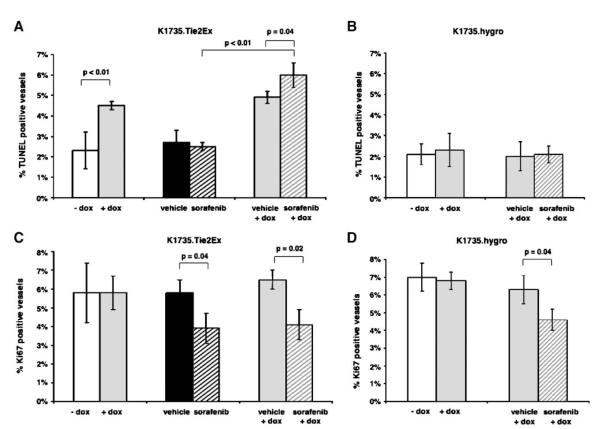
FIGURE 6.
Endothelial cell fate of K1735.Tie2Ex tumors treated with Tie2Ex and sorafenib. Tumor sections were stained for TUNEL and CD31 or Ki-67 and CD34 to identify apoptotic vessels (A and B) or proliferating vessels (C and D). Percentage of apoptotic vessels in K1735.Tie2Ex tumors (A) and K1735.hygro tumors (B) was calculated and plotted as a histogram. Percentage of proliferating vessels in K1735.Tie2Ex tumors (C) and K1735.hygro tumors (D) was calculated and plotted as a histogram. Histogram plot represents values obtained from counting vessels in two sections of at least three different tumors for each group. Student’s t test statistical analysis was done. P < 0.05 and P < 0.01 were considered highly significant.

