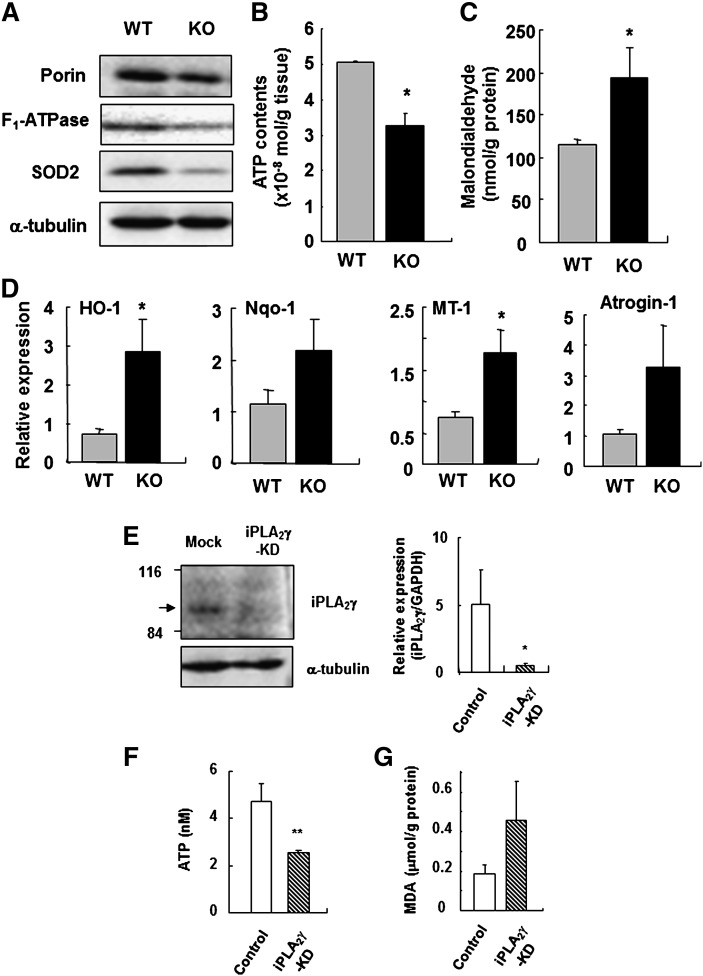
Fig. 3.
Mitochondrial dysfunction and increased lipid peroxidation by lacking of iPLA2γ expression. A: Western blot analysis of mitochondrial markers in iPLA2γ-WT and -KO muscles at four months of age. A blot for α-tubulin was used as a loading control. B: ATP contents in skeletal muscles from WT (gray bar) and KO mice (black bar) (n = 3). Quantitative data are means ± SE. *, P < 0.05 versus WT. C, lipid peroxidation assay of skeletal muscles in WT (gray bar) and KO mice (black bar) (n = 7). Quantitative data are means ± SE. *, P < 0.05 versus WT. D, Q-PCR analysis of the mRNA expression for antioxidant-defense enzymes in skeletal muscles from WT (gray bar) and KO mice (black bar) (n = 6-7). Quantitative data are means ± SE. *P < 0.05 versus WT. E: Reduction in iPLA2γ protein (left) and mRNA (right) expression after transfection of the C2C12 myoblast cells. Quantitative data are means ± SE. *P < 0.05 versus WT (n = 3). F: ATP contents in control (white bar) and iPLA2γ-KD C2C12 cells (striped bar). Quantitative data are means ± SE. **P < 0.01 versus control (n = 3). G: Lipid peroxidation assay of control (white bar) and iPLA2γ-KD C2C12 cells (striped bar) (n = 5). Quantitative data are means ± SE. *P < 0.05 versus WT. Abbreviations: CT, computed tomography; iPLA2, calcium-independent PLA2; KO, knockout; Q-PCR, quantitative RT-PCR; WT, wild-type.

