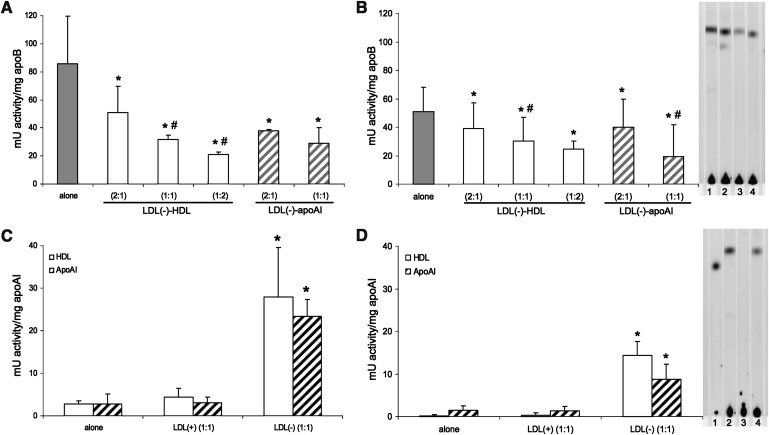
Fig. 4.
PLC-like activity of LDL(–), HDL and apoAI, in native state and after treatments. The proportion of apoB:apoAI used in preincubation is indicated: 1 = 0.5 g apoB/L of LDL and 0.5 g apoAI/L of HDL. In the assay, 30 μg of apoB (LDL) or apoAI (HDL) were used. The PLC-like activity was calculated in mU activity/mg apoB or apoAI based on the maximal slope of 3 h kinetics. PLC-like activity of LDL(–) in native state and incubated with HDL and apoAI is shown in (substrate: LPC) and B (substrate: SM). Activity of LDL(–) alone is shown in gray bars, preincubated with HDL in white bars, and preincubated with apoAI in striped bars. Activity of HDL and apoAI in native state and incubated with LDL(+) and LDL(–) is shown in (LPC) and D (SM). HDL is represented in white bars and apoAI in striped bars. Data are the mean±SD of four experiments. Significant differences with P = 0.068 are indicated: * versus the respective untreated condition and # versus the lower concentration of treatment. Formation of ceramide-BODIPY by degradation of fluorescent substrate (SM-BODIPY) was evaluated by TLC. In the assay, 50 μg of apoB (LDL) or apoAI (HDL) were used. Representative TLC images are shown in [1: LDL(–), 2: LDL(–)-HDL (2:1), 3: LDL(–)-HDL (1:1), 4: LDL(–)-apoAI (2:1)] and D [1: ceramide-BODIPY, 2: HDL-LDL(–) (1:1), 3: HDL, 4: apoAI-LDL(–) (1:1)].

