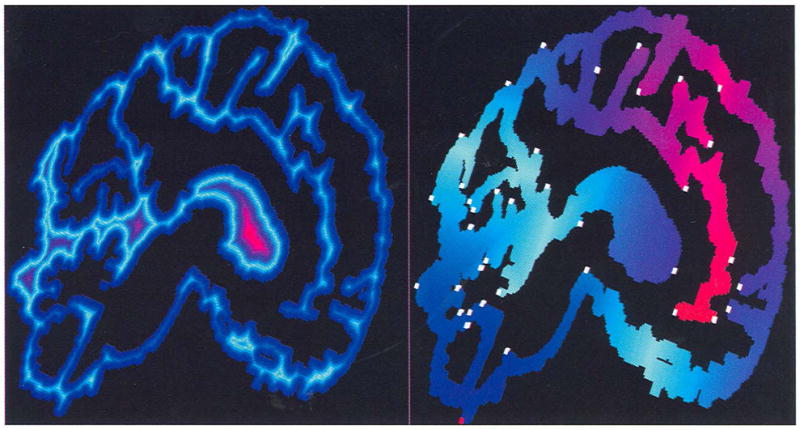
Fig. 1.

Examples of an BS-fteld (left) and SS-field (right). The object inciudes only one slice with a size of 512 × 512 from a brain MRI data set. The black region consists of outside voxels. The BS-field is generated by voxel coding starting from the object boundaries using the “3-4-5” metric, while the SS-field is created by voxel-coding, starting from the lowest point (marked with a red voxel) using the “1 -2-3” metric. Two fields are displayed with the same color mapping scheme: For each field, the whole code is divided in four equal intervals, then each interval is colored with linear interpolation from two colors. In the code-increasing order, the five colors used are blue, light blue, purple, red, and yellow. The voxels marked with white blocks are local maximum clusters.
