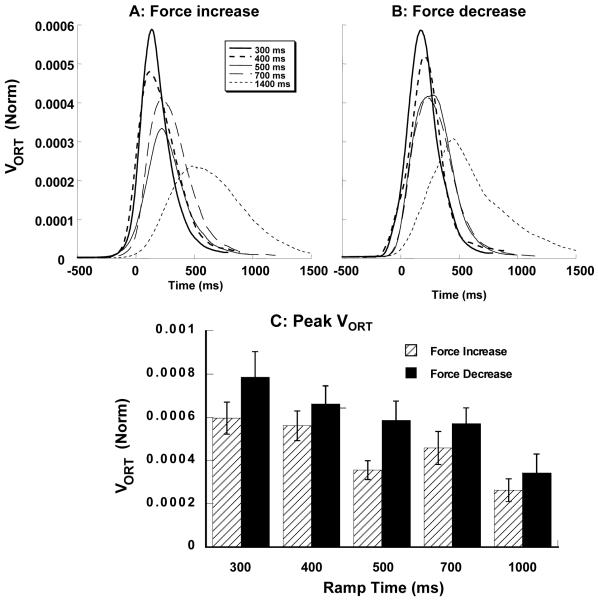
Figure 5.
Variance orthogonal to the UCM, VORT averaged across subjects for the force increase ramps (A) and force decrease ramps (B). C: Peak VORT for the different ramp times and two directions of force change. Averaged across subjects data with standard error bars are shown. The values were normalized by MVC squared and by the number of dimensions within the ORT sub-space. Note that VORT shows a bell-shaped profile; it increases for faster tasks.

