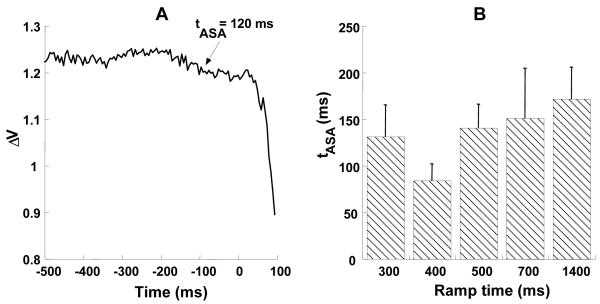
Figure 9.
A: A typical time profile of ΔV showing a decrease in ΔV that starts about 120 ms before force change initiation (t0). B: Time of ASA initiation (tASA) as a function of ramp time. Averages across subjects with standard error bars are presented. tASA shows no consistent change across ramp times.

