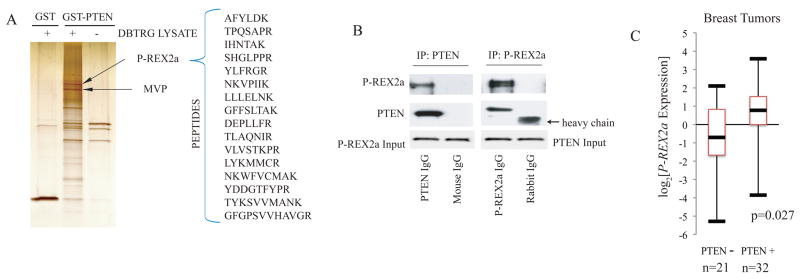
Fig. 1. P-REX2a as a PTEN-binding protein.
(A) Silver stain of 1M salt elutions of affinity purified PTEN binding proteins. GST and GST-PTEN columns were incubated with (left, middle) and without (right) DBTRG-05MG cytoplasmic extract and proteins eluted with high salt were separated and identified by mass spectrometry. P-REX2a and MVP are indicated with arrows. (B) Co-immunoprecipitation of endogenous PTEN and P-REX2a. Immunoprecipitions were performed as per Materials and Methods and proteins were detected by immunoblotting. (C) Box plot of P-REX2a expression in PTEN positive and negative breast tumors. Upper and lower bars represent the maximum and minimum expression respectively. The box delineates the first to third quartiles of expression and the central bar represents the median. P-REX2a levels are significantly associated with PTEN status (p=0.027) by two-tailed t-test.

