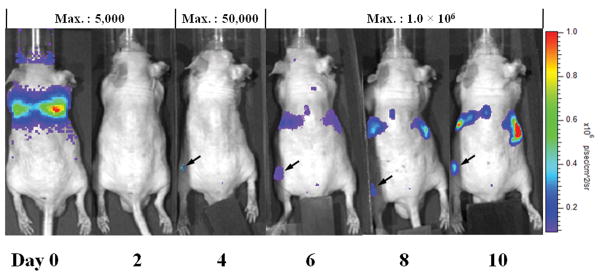
Fig. 1. In vivo imaging of UHMWPE particles injected in the left femur of a nude mouse from day 0 to day 10 post-injection of Fluc labeled macrophages.
The animal is lying in the prone position. The bioluminescence from implanted femur can be detected since day 4 (arrowed). The Maximum reading of the scale bar for different days of imaging are listed on the top of the graph. The unit of the signal is p/s/cm2/sr as shown in the right of the figure.

