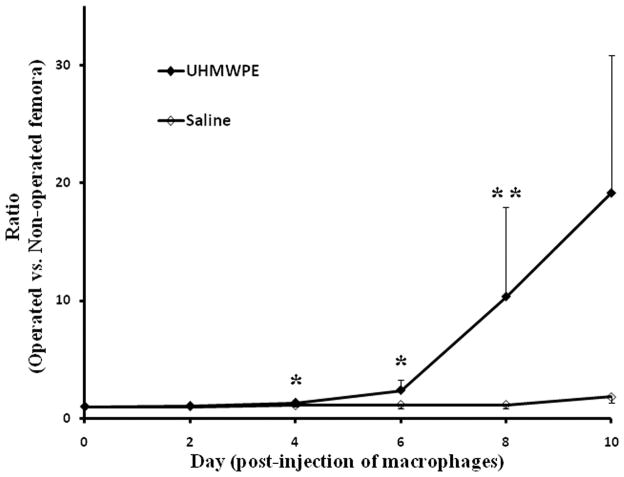
Fig. 2. The ratio of bioluminescence of 60 mg/ml (w/v) UHMWPE particle suspension femora, and saline injected femora versus bioluminescence of the corresponding non-operated contralateral femur from day 0 to 10 post-injection of macrophages.
The Y-axis is a normalized ratio of bioluminescence (unit: p/s/cm2/sr) from the operated femur versus non-operated femur in each animal. The values represent: mean ± SE. Number of animals in UHMWPE and saline injected groups are 30 and 13, respectively. Non-parametric Mann-Whitney test: *: p < 0.1; **: p < 0.05.

