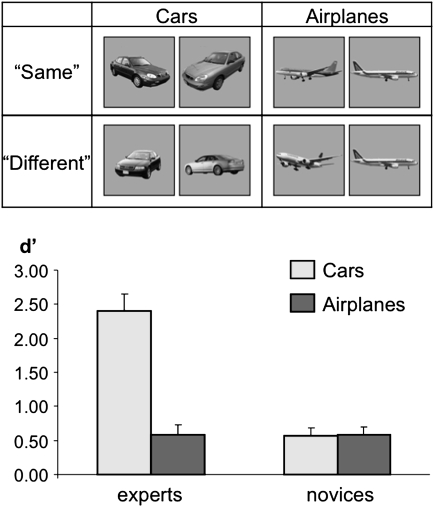
Figure 1.
Behavioral performance in the expertise assessment task. Top: examples of the stimuli viewed in the expertise assessment experiment are presented. In each trial, subjects viewed a pair of sequentially presented private cars or passenger airplanes and had to indicate whether the 2 stimuli were of the same model or of a different model (examples for an expected “same” response are presented in the top row and for expected “different” response in the bottom row). Trials consisted of 500-ms image presentation followed by 500-ms fixation image after which the second image appeared for 500 ms. Bottom: mean performance (d′) of the car experts and the car novices in the expertise assessment task. Car performance is indicated in light gray, airplane performance in dark gray. Note the low level of performance of the car novices in both the car and airplane conditions, similar to the performance of the car experts in the airplane condition and in comparison the car experts’ superior performance in the car condition. Error bars indicate standard error of the mean (SEM).

