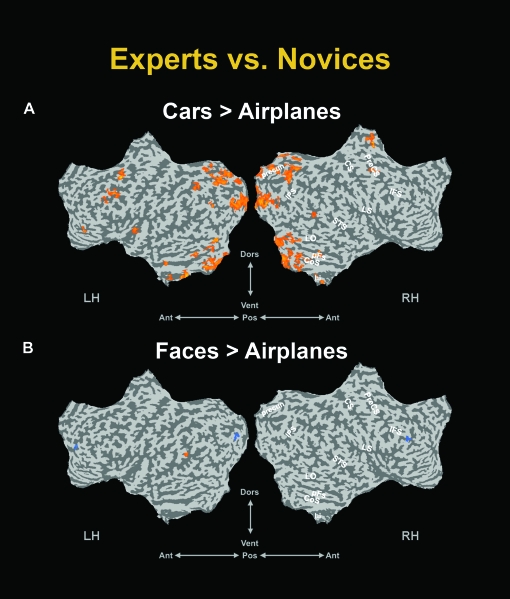
Figure 3.
Experiment 1 intergroup comparisons. Experiment 1′s group contrast (Experts vs. Novices) multisubject maps for the cars versus airplanes contrast (A) and the faces versus airplanes contrast (B), displayed on flattened cortical surfaces. These statistical maps show up the significant difference between the groups for the contrast specified (P < 0.0001, RE, corrected, minimum cluster size of 10 contiguous functional voxels. Experts: n = 13, Novices: n = 14). Hence,yellow to orange patches denote in (A) car-selective regions that were more activated in experts than in novices (i.e., defined by the contrast [cars > airplanes]experts > [cars > airplanes]novices) and in (B) face-selective regions that were more activated in experts than in novices (i.e., defined by the contrast [faces > airplanes]experts > [faces > airplanes]novices). The light blue patches denote regions exhibited negative results to these contrasts. Presentation format and anatomical landmarks as in Figure 2.

