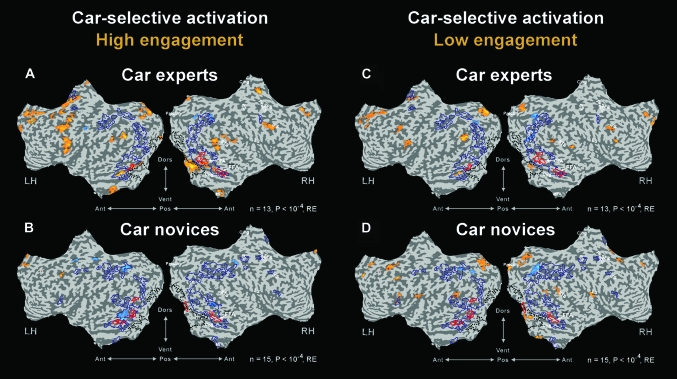
Figure 6.
Experiment 2 high and low engagement car-selective activation maps. Experiment 2 multisubject activation maps of car experts and car novices’ are displayed on flattened cortical surfaces. Presentation format, anatomical landmarks, and functional borders (black dotted line, red and blue delineation) as in Figure 2. Left column: high engagement (task-relevant) condition of the car experts (A) and car novices (B). Right column: low engagement (task-irrelevant) condition of the car experts (C) and of the car novices (D). Yellow to orange patches denote car-selective activation (compared with airplanes) defined by the contrast (cars > airplanes and cars > baseline). The light blue patches denote the negative to that contrast. All the statistical contrasts were obtained with corrected P < 0.0001, RE analysis, n = 13 experts in the experts maps, n = 15 novices in the novices maps.

