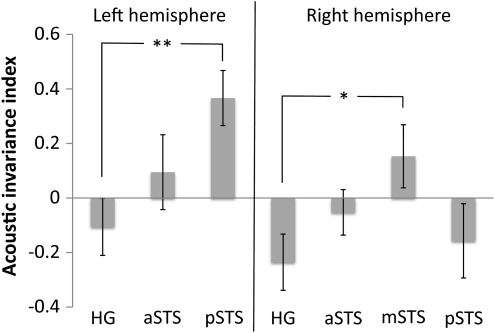
Figure 6.
Acoustic invariance across the 7 ROIs as measured using an acoustic invariance index (see text). This index effectively ranges from −1 to 1 where positive values indicate higher degrees of acoustic invariance and negative values indicate lower degrees of acoustic invariance (i.e., more acoustic sensitivity). *P < 0.05, **P < 0.01, 2 tailed.

