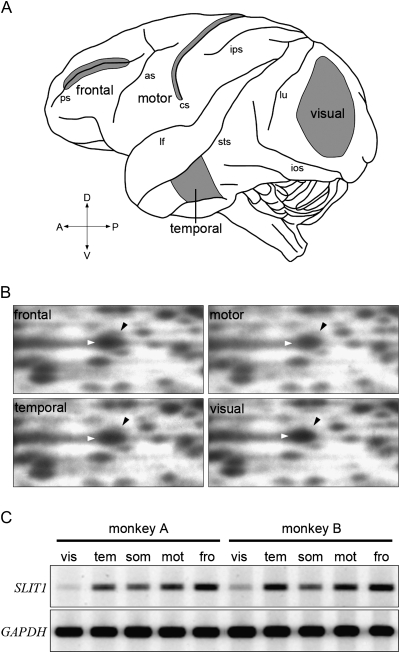
Figure 1.
RLCS profiles for 4 different cortical areas. (A) Lateral surface view of a monkey brain. Anterior is to the left and posterior is to the right. Major sulci are indicated by lower case letters: ps, principal sulcus; as, arcuate sulcus; cs, central sulcus; ips, intraparietal sulcus; sts, superior temporal sulcus; ios, inferior occipital sulcus, and lu, lunate sulcus. Samples for RLCS analyses were taken from the 4 cortical areas in gray; frontal, temporal, motor, and visual areas. (B) A cDNA spot for SLIT1 exhibited differential intensity in each of the RLCS gels for the 4 distinct areas of the neocortex depicted in panel A. Each black arrowhead indicates the spot corresponding to SLIT1 cDNA, which is located in the upper right position of the larger spot that is observed in all areas (white arrowheads). Although the spots shown by the white arrowheads were observed in all the areas, the signal intensity of SLIT1 spot in the visual area was lowest. (C) Semiquantitative RT-PCR demonstrated that the SLIT1 mRNA expression level was the highest in the frontal area and lowest in the visual area. Essentially the same result was obtained from 2 different individuals. Glyceraldehyde-3-phosphate dehydrogenase (GAPDH) gene was used as the control for constitutive expression. vis, visual; tem, temporal; mot, motor; fro, frontal; and som, somatosensory areas.

