
Figure 2.
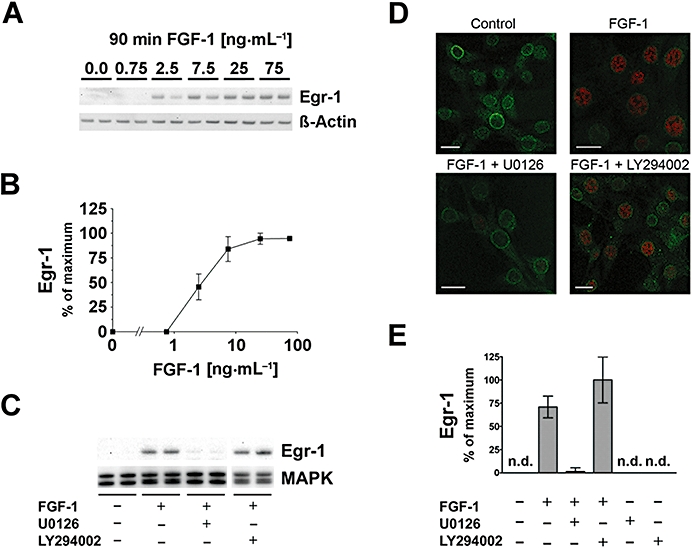
FGF-1 induces Egr-1 in hippocampal HT22 cells. (A) The transcription factor Egr-1 was concentration-dependently elevated after 90 min of FGF-1 treatment, as shown in a representative Western blot. Corresponding signals for β-actin are shown as loading control. (B) Quantification of Western blot dose–response actin-normalized data ± SD, n = 4–10. (C) FGF-1-mediated Egr-1 was strongly inhibited by the MEK-1/2 inhibitor U0126, but not by the PI3K inhibitor LY294002 (both 10 µM). Total MAPK is shown as a loading control. (D) Immunofluorescence images reveal that after 90 min of FGF-1-induced Egr-1, immunoreactivity (red) in the nucleus was strongly inhibited by the MEK-1/2 inhibitor U0126, but not by the PI3K inhibitor LY294002. An antibody against NPCP (green) is used as a counter-stain (bars = 20 µm). (E) Quantitative analysis of Western blot data showing that FGF-1 induced Egr-1 protein levels which were not significantly affected by PI3K inhibition, but were abolished by MEK-1/2 inhibition. Neither U0126 nor LY294002 influenced Egr-1 when applied alone. All bar graphs show the mean ± SD of three independent experiments (n = 6–9).