
Figure 2.
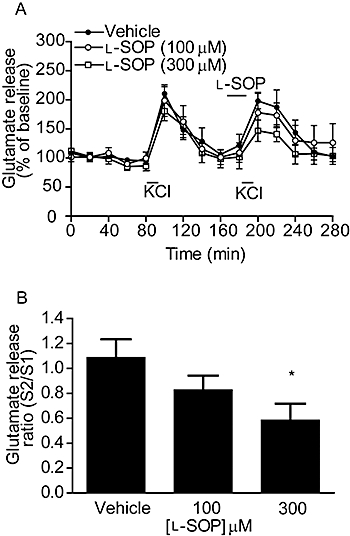
Effect of l-SOP on 100 mM KCl-evoked glutamate release in the rodent SNpr in vivo. (A) Release profile showing the effect of vehicle or l-SOP on release evoked by the second KCl stimulus, S2. Horizontal bars indicate the periods of contact with KCl or l-SOP/vehicle. (B) Graph of S2/S1 ratio showing concentration-dependent effect of l-SOP on glutamate release. In both cases, data are mean ± SEM (n = 4). *P < 0.05 significantly different from vehicle.