
Figure 3.
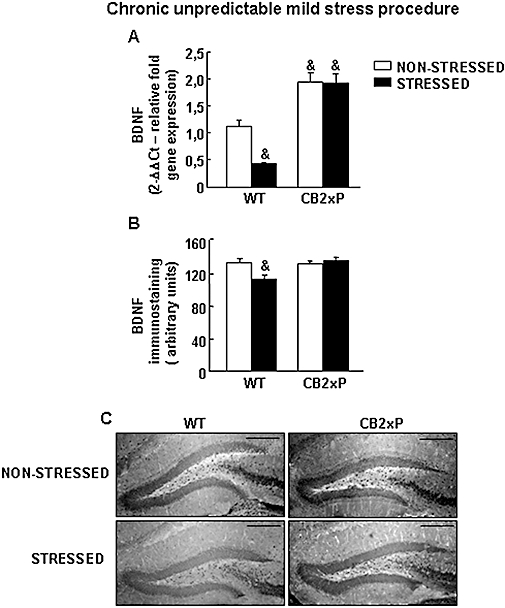
Brain-derived neurotrophic factor (BDNF) gene and protein expression in CB2xP and WT mice exposed to CMS. (A) Relative BDNF mRNA levels in the hippocampus of CB2xP and WT mice exposed to CMS. Columns represent the means and vertical lines represent the SEM of relative BDNF mRNA gene expression. &Values from non-stressed WT mice, stressed and non-stressed CB2xP mice that differ significantly from the non-stressed WT group (two-way anova followed by Student–Newman–Keul's: P < 0.05) (n = 5–7 per group). (B) Quantification of BDNF immunostaining in the hippocampus of CB2xP and WT mice exposed to CMS. Columns represent the means and vertical lines represent the SEM of relative BDNF protein (arbitrary units). &Values from stressed WT mice that are significantly different from non-stressed WT mice (two way anova, followed by Student–Newman–Keul's, P < 0.05) (n = 6–8 per group). (C) Representative immunostaining pictures for BDNF protein in hippocampus of CB2xP and WT mice exposed to CMS. Bar represents 1 mm. CB2xP mice, transgenic mice overexpressing the CB2 receptor; CMS, chronic mild stress tests; WT, wild-type.