
Figure 2.
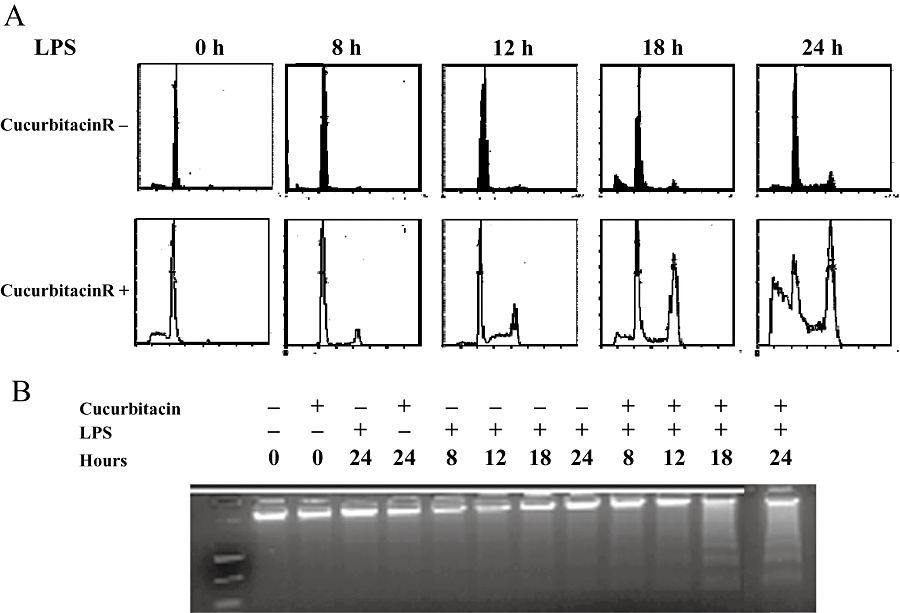
Cell cycle evolution after lipopolysaccharide (LPS) stimulation. (A) Inhibition of G0/G1 phase, G2/M arrest and apoptosis in cucurbitacin R-treated cells. Plots were obtained with propidium iodide staining at different times after cucurbitacin R (100 µM) treatment with or without LPS stimulation on RAW 264.7 macrophages. (B) DNA was obtained as described in the Methods section and the isolated DNA run on agarose gel (1.5%). DNA fragmentation was observed 18 and 24 h after cucurbitacin R treatment with LPS. Figures are representative of three experiments performed with similar results.