
Figure 6.
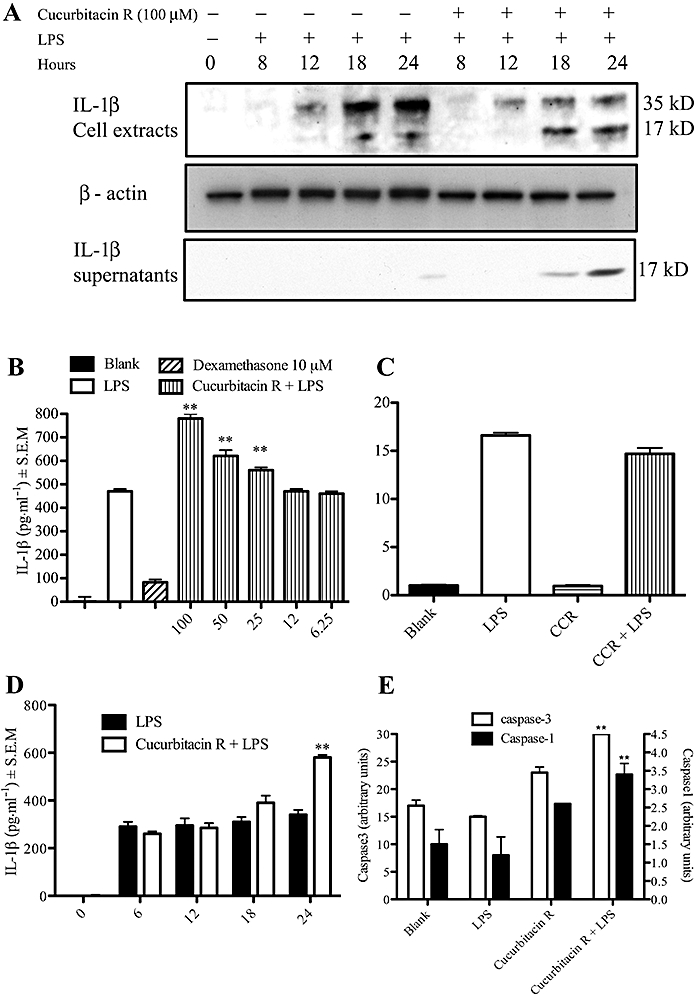
Cucurbitacin R treatment produced an increase in the release of interleukin-1β (IL-1β) in RAW 264.7 macrophages due to an increase in caspase-1 activity. (A) Western blot analysis on RAW macrophages cell extracts and cells supernatants of IL-1β. Cells were treated with cucurbitacin R (100 µM) and lipopolyysaccharide (LPS) for different times and IL-1β levels were determined in cell lysates or supernatants as described in the Methods section. (B) Cells were treated with cucurbitacin R (6.25–100 µM) or dexamethasone (10 µM) for 24 h and IL-1β levels were determined in cell lysates as described in the Methods section. (C) Real time reverse transcription-polymerase chain reaction (RT-PCR). RAW macrophages were treated with cucurbitacin R (100 µM) and LPS. Cells were collected after 8 h of LPS stimulation and real time RT-PCR were carried out as described in Methods. (D) Time course effect of cucurbitacin R in LPS stimulated RAW 264.7 cells. Columns represent cytokine production in pg mL−1 in the presence or absence of test compounds with SEM and statistical significance: blank (untreated cells), control (LPS-stimulated cells). (E) Caspase activity in cucurbitacin R-treated cells. Cells were treated with cucurbitacin R 100 µM with or without LPS for 24 h and cell lysates were incubated with respective caspase-1 and caspase-3 fluorometric substrates for 2 h. The vertical lines indicate the SEM. Statistically significant difference with respect to the control is expressed as **P < 0.01 (Dunnett's t-test). Figures are representative of three experiments performed with similar results.