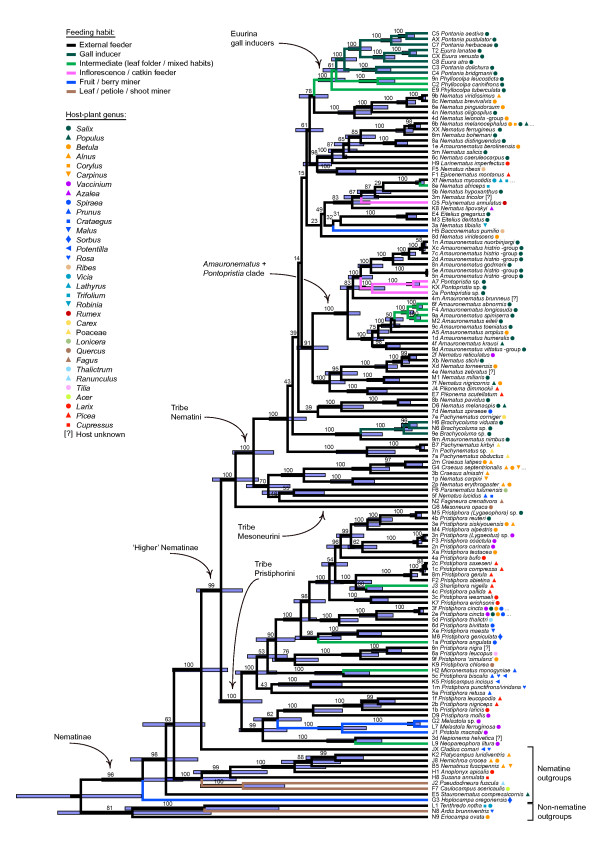
Figure 4.
Relaxed molecular-clock phylogeny of the Higher Nematinae, and the evolution of different larval habits within the group. The maximum clade credibility tree resulted from a topologically unconstrained Bayesian phylogenetic analysis employing a relaxed lognormal clock and a separate GTR+I+Γ4 model of substitution for each gene. Numbers above branches show posterior probabilities (%), and blue shaded bars the 95% highest posterior density intervals for relative node ages for nodes with probabilities over 50%. Branch colors denote larval feeding habits according to unordered maximum-parsimony optimization, symbols to the right of species names show host-plant genera and families of the exemplar species (see legend). Full host ranges of polyphagous species are given in Additional file 1.

